


Short-Term Trends Turn Bearish Across Major Indices, Sectors, and Global Markets
Defensive Sectors Outperform as Bitcoin and Energy Stocks Enter Long-Term Downtrends

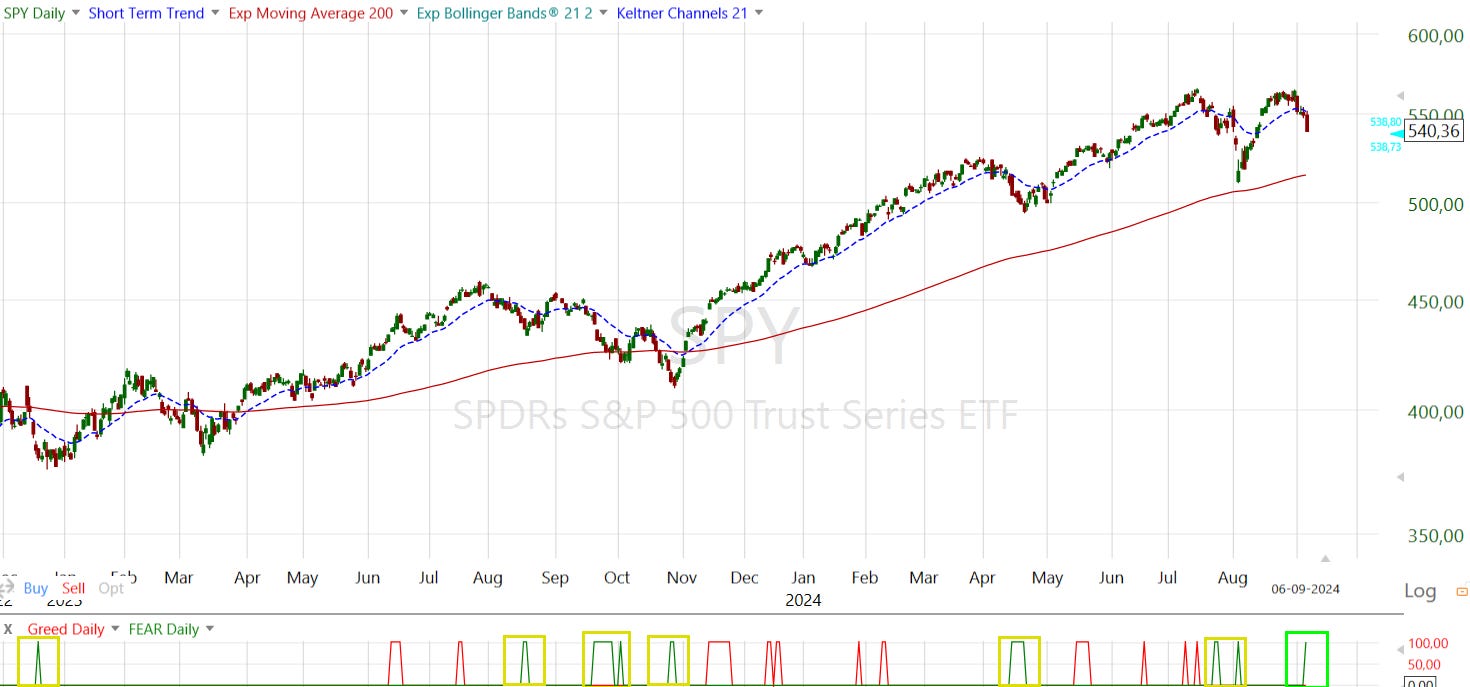
What a rough start for September! The S&P 500 dropped more than 4% this week, while the Nasdaq-100 and Russell 2000 took even larger hits, losing nearly 6%. The semiconductor sector, which has been leading the market all year, plummeted over 11%—a sharp and painful decline.
I anticipated some turbulence in the short term, but the intensity of this selling pressure was unexpected.
For short-term traders, the last three months have been particularly challenging. Despite this, the longer-term outlook remains positive when considering both technical and fundamental indicators. However, some of the more speculative sectors have been hit hard, with some even flipping into long-term downtrends.
Let’s take a closer look at the charts and dive deeper into what’s happening in the stock market.
Breadth and Trend Studies:
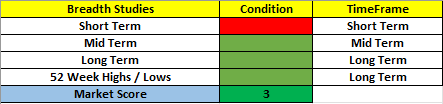
Only short-term conditions turned negative this week, while mid-term indicators remain positive, and longer-term measures are still firmly in bullish territory. This suggests we're likely in the midst of a pullback or potential correction, which could eventually present a good buying opportunity.
Trend analysis shows that in the short term, all major indices, Bitcoin, and the VIX have entered bearish territory. However, longer-term signals for the major indices remain positive, though Bitcoin has flipped into a long-term downtrend—a sign of weakening speculative sentiment.
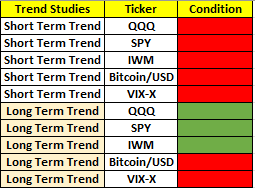
As mentioned in my previous blog, the VIX continues to signal a long-term uptrend, which is bearish. This suggests that market volatility will persist, with downward moves carrying stronger momentum.
When analyzing the major indices and sectors, it's clear that most are showing short-term downtrend signals, confirming the ongoing pullback or correction phase in the market.
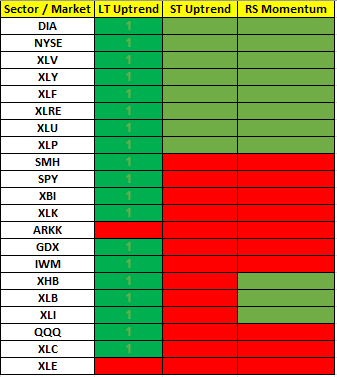
Notably, the ARKK ETF, which focuses on speculative tech stocks, recently flipped to a long-term downtrend, similar to Bitcoin. This shift signals a broader retreat from speculative euphoria. Additionally, energy stocks have also transitioned into a long-term downtrend this week.
On the other hand, strength is emerging in traditionally defensive sectors such as healthcare, utilities, the Dow Jones Industrial Average, and consumer staples. Interestingly, we're also seeing resilience in interest-sensitive sectors like real estate, financials, and consumer discretionary.
Oversold Signals:
Given the intensity of last week’s selling pressure, short-term oversold signals are now emerging across several key indices and sectors. Currently, the S&P 500, energy sector (XLE), oil (USO), emerging markets (EEM), technology (XLK), the Nasdaq-100 (QQQ), gold miners (GDX), semiconductors (SMH), and Bitcoin have all triggered short-term oversold signals.
With these oversold signals, there’s a possibility the market could stabilize or find a bottom in the coming days. However, oversold conditions can deepen, and we're still some distance from the extreme short-term oversold levels seen during the recent August bottom or in April of this year. With the notable deterioration in short-term breadth and the number of sectors and indices that flipped to a downtrend this week, it’s likely we’ll experience further downside before the market finds a true bottom.
Yen Carry Trade Unwind:
Last week’s intense and persistent selling pressure mirrors the market action from late July to early August, when large-scale stock liquidations occurred due to the unwinding of the USD/JPY carry trade. Ed Yardeni suggests that the current stock market behavior may be driven by a similar phenomenon. Yardeni states: “The carry trade is still unwinding. Expectations that the Fed will lower our interest rates, while the Bank of Japan raises their interest rates are boosting the yen and forcing traders to unwind their carry trades, which were executed when they borrowed yen at near-zero interest rates to buy assets with higher returns in other currencies, especially the Magnificent 7 and semiconductor stocks in the US. There has been a strong inverse correlation between the yen and the Nasdaq 100 since the start of 2023.”

Conclusion:
We have quickly and sharply entered a risk-off phase in September, with most short-term trend and breadth indicators turning bearish. Additionally, some speculative assets have seen their long-term trends flip negative this week. This suggests the current pullback or potential correction still has room to run before the market resumes its primary uptrend.
That said, longer-term trend and breadth signals remain positive, and the key fundamental and macroeconomic data continue to support higher stock prices. For long-term investors, the outlook remains bullish. I maintain my view (for now) that this sell-off will ultimately present another excellent buying opportunity.
In the near term, however, we are likely to experience more volatility and downside pressure, so caution is advised for short-term traders.
That is all for today.
Best regards,
Victor Riesco, CMT